
Information on the gut microbiota testing service
Report form
Figure of terminal restriction fragments (T-RF) profiling
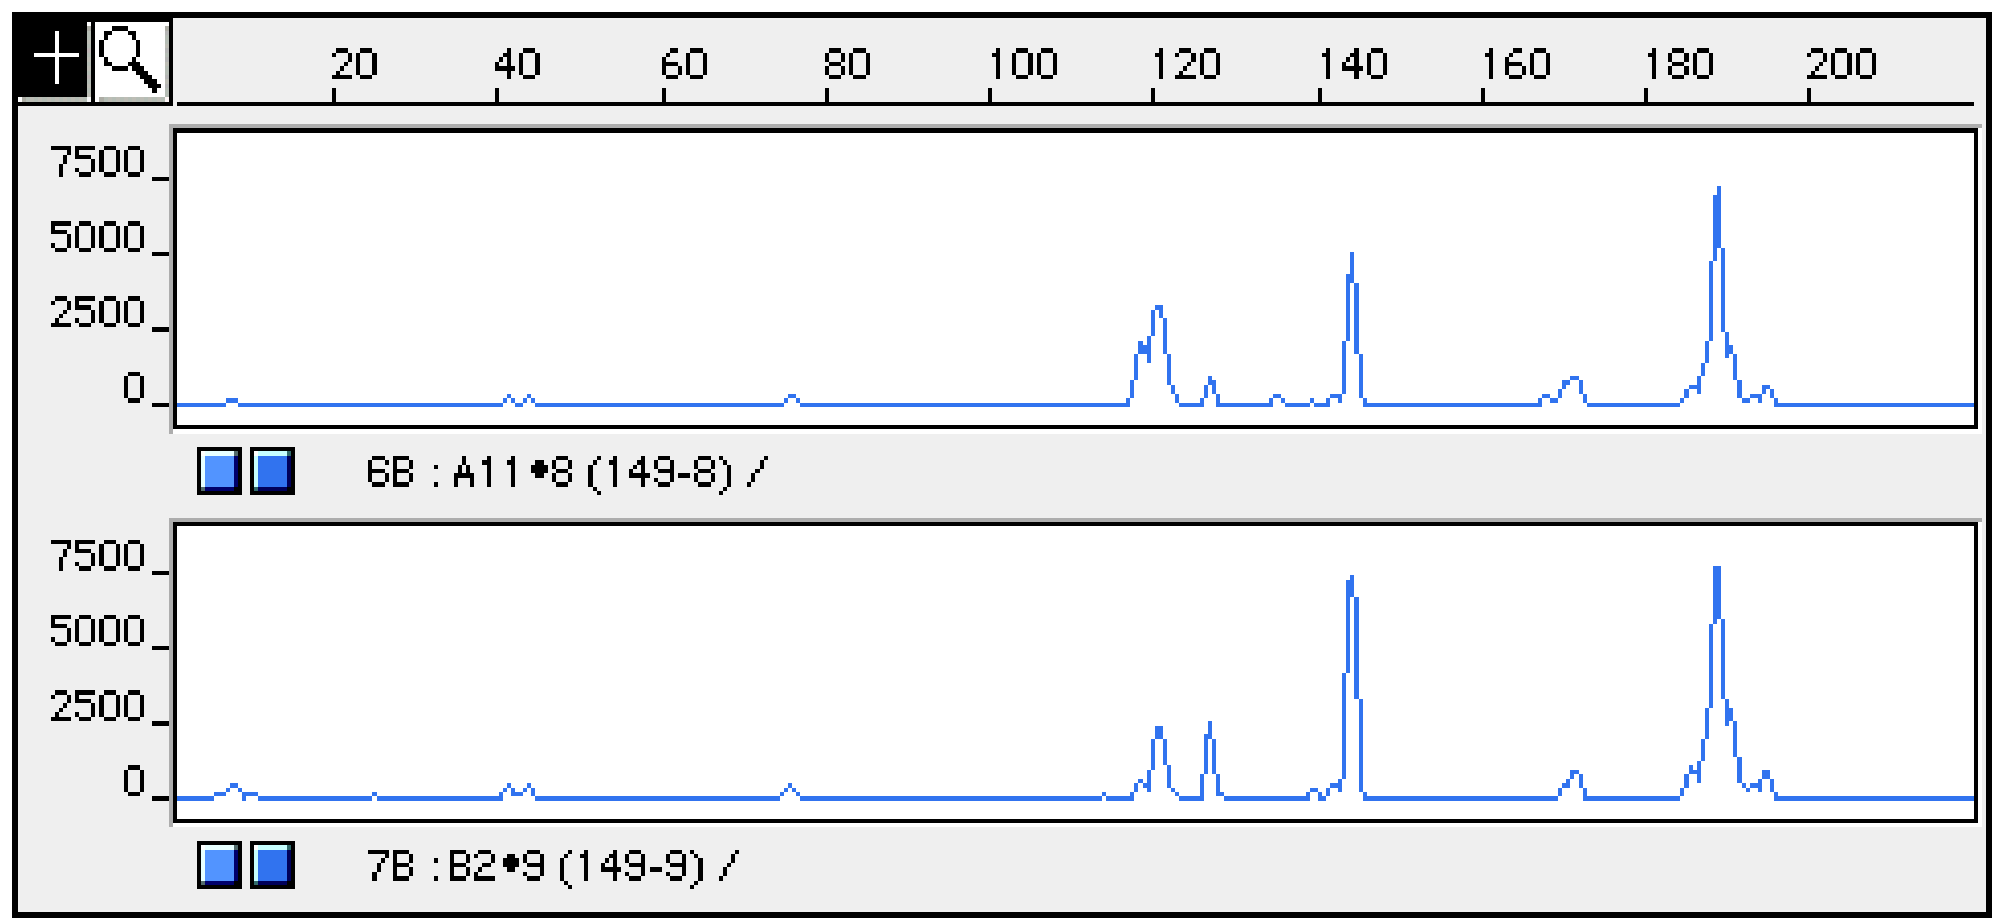
Capillary electrophoretic gel image of the HpyCH4III-digested PCR amplicons from the sample. The horizontal axis represents fragment length (bp) and the vertical axis represents fluorescence intensity, making it easy to compare the positions and numbers of peaks.
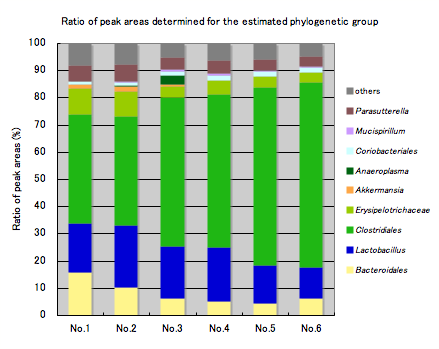
Ratio of peak areas determined for the OTU* and estimated phylogenetic groups
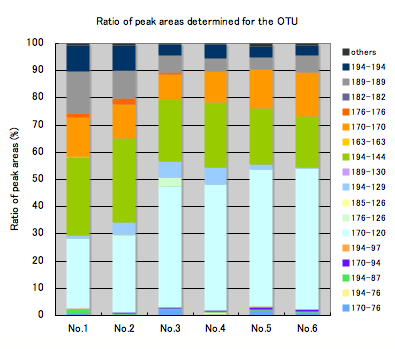
Left: Ratio of peak areas determined for the OTU
The graph shows the relative ratios (%) for individual OTUs, which are generated from the detected peaks. Differences in microbiota between the samples can be visibly compared on the graph.
Right: Ratio of peak areas determined for the estimated phylogenetic groups
The graph shows the relative ratios (%) of phylogenetic groups, which are estimated from the OTUs. The population of individual phylogenetic groups can be estimated.
* Even fragments differing by a couple of bp in length generally derive from the same phylogenetic group; fragments in a certain peak range are defined as a single OTU.
Comparative analysis of microbiota
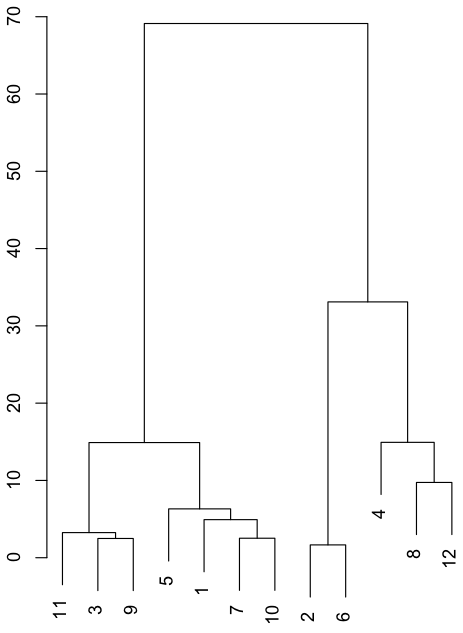
Cluster analysis and principal coordinates analysis
![]()
![]()
Left: cluster analysis
A tree diagram generated using T-RFs profile data. A cluster is created using samples with similar composition.
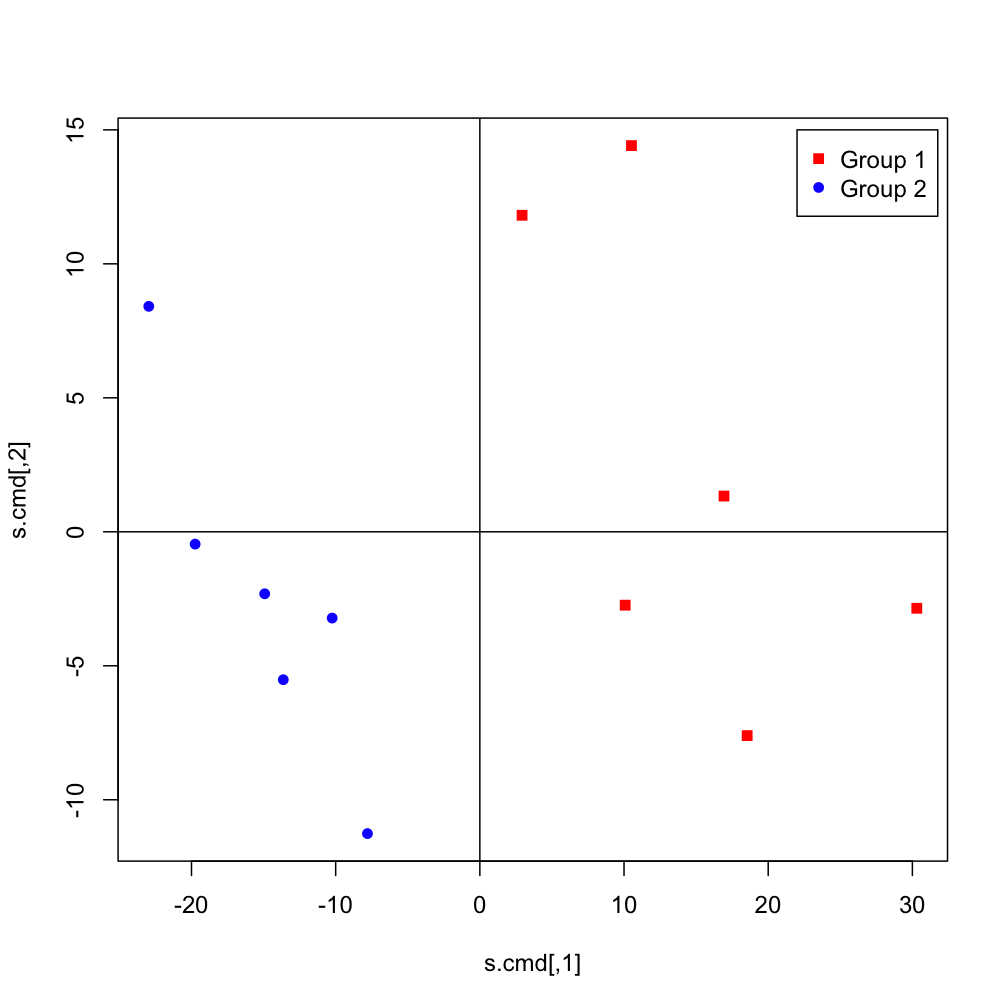
Right: Principal coordinates analysis
A scatter diagram generated using T-RFs profile data. Samples with similar composition are plotted around the common coordinate.


- ・Gut microbiota testing
- ・Report format